Beta Address: http://blish.org/sdrdxdoc/waterfall1.html
5.19 - RF Waterfall
5.19.1 - About these displays

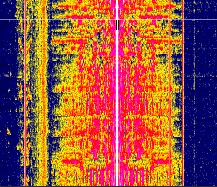
RF Waterfall
These displays are the product of some math that utilizes the number of samples you pick in the Display dialog under "FFT Size." So the larger you make the FFT for any one SDR sample rate (see the Display dialog), the longer it takes to accumulate that many samples, and the slower the waterfall and RF spectral displays will run.
Conversely, if you leave the display bandwidth at a lower setting, for instance 100 KHz, but set the SDR sample rate higher at 190 KHz, then the display can run faster than if you set them both to 100 KHz because the number of samples required to evaluate the FFT will be collected almost twice as fast as they would if you set both the display span and the sample rate to 100 KHz.
The larger the number of samples you set for the FFT size, the more detailed the waterfall and spectrum displays become for any given bandwidth.
FFT averaging takes each successive set of values and averages them with the previous set(s), resulting in a smoother display with a reduced peak response rate.
5.19.2 - Adjusting the Waterfall
You can adjust the RF waterfall display in several ways. First, by moving the vertical controls I and C
and C to the right of the S-Meter. These change the color in the waterfall according to the received signal strength. C
 controls the contrast, and I
 the intercept, or where a particular level matches the palette.
 , even when the noise floor changes significantly. It will track both in band, and when you change bands, as long as the noise floor is S1 or above. Right-clicking allows you to set the rate of noise floor tracking.
 setting; in addition, these two keys can set the bias well beyond where the sliders can, which can help in some extreme situations.
Second, by changing the top left control's dB/Div setting, which increases the displayed amplitude of the received signal, and also the intensity of the color change in the waterfall.
When you adjust the dB/Div setting, you'll usually want to readjust I and C
and C as well. Exact settings will depend on the palette you are using and your taste.
When you re-adjust the Max dB setting, readjusting only I should be sufficient.
When you adjust the dB/Div control, adjusting C will likely be called for.
5.19.3 - Time, Freq and BW Stamps
Turning on causes the waterfall to have data markings stamped on it with a semitransparent bar extending all the way across the waterfall; at the left, the time and date are stamped, at the right, the center frequency and bandwidth are stamped, and at the center, a short white-on-black marker denotes the location of the center frequency. This stamp is saved when you use to save continuous waterfall images.
See this page to learn how to create and load custom waterfall palettes.
5.19.4 - Displaying the Demodulator on the Waterfall
With on, variably opaque indicator lines will be shown on the waterfall just outside the demodulator upper and lower bounds. Right-clicking on will bring up an opacity control for these indicator lines and a DOW display timeout control. The DOW display timeout control, if set to zero, will result in the DOW bars never timing out. When set to 1, timeout is ten seconds after a frequency change. at .5, it's five seconds, and so on.
| toc | index | guide | changes | keyboard | , previous | . next |