Beta Address: http://blish.org/sdrdxdoc/sigdisp1.html
5.20 - RF Signal Display
You can use and to adjust the visible width of the spectrum; however, the maximum usable width is limited by the SDR's sample rate setting as set by the button.
5.20.1 - Grid Spacing

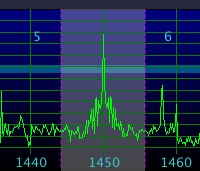
RF Signal Display
Pressing or W will change the number of horizontal grid divisions (vertical lines) on the spectrum. There are numerous settings which are designed to assist you when the Span is set to various values.
Pressing will turn the frequency indication text on and off. When using SdrDx to monitor an IF rather than the actual spectrum, this is useful so that the frequencies of the IF monitoring are not presented, but you can still have the grid present and set to every ten KHz, etc.
5.20.2 - Graticule and Demodulator Appearance
You can also adjust the intensity of the graticule and the demodulator bandwidth bar by adjusting the GRT (Graticule) and BPA
 (Bandpass) respectively.

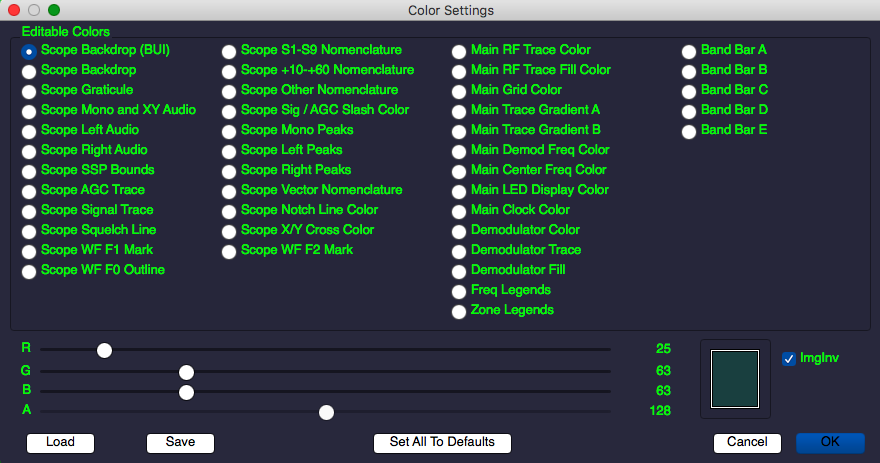
Color Control Dialog
5.20.3 - Spectrum Trace Waveform Color
You can set the spectrum trace color via the  Main RF Trace setting in the dialog available via →Left-click.
5.20.4 - Spectrum Trace Waveform Fill Color
You can adjust the appearance of the RF waveform fill color by adjusting the  Main RF Trace Fill Color setting in the dialog available via →Left-click, and turn the waveform fill on and off using the (RF Waveform Fill) control.
5.20.5 - Signal Amplitude and Baseline
You can adjust the displayed amplitude of the signals by selecting how many dB per division using the dB/Div control at the top left of the control panel, and also by adjusting the Max setting which controls the maximum value the top of the spectrum display refers to.
5.20.6 - Spectrum amplitude relationship to S-Meter readings
S-Units on properly calibrated receivers (for instance, the RFSPACE SDR-IQ) equate to almost exactly 6 db per s-unit. Because of this, if you set the RF spectrum amplitude to 6db/Div, each horizontal grid line will correspond to one s-unit relative to the next and previous lines. At 3 dB/Div, each horizontal grid line will correspond to two S-Units.
5.20.7 - Band Indicators
On the RF signal display, if is on, you'll see band indicators when you are tuned to, or near, a formally defined RF band. Yellow indicates an amateur radio CW and data band. Green indicates an amateur radio phone (voice, CW, data, SSTV) band. Light blue indicates a broadcast band. Gray indicates a utility band. Violet indicates a channelized region. These colors can be changed in the color settings dialog.
5.20.8 - Peak Tracking
Tracked peaks, enabled with , are detected by how sharp they are. So if you narrow the span () sufficiently, which also widens peaks, peak detection will stop. You can, up to a point (lol), bring them back by increasing the FFT resolution in the (DiSPlay) dialog. You can also affect how fast the FFT data is generated by increasing the SDR sample rate.
5.20.9 - Convenience markers
Pressing ^ M will set a user convenience marker (a small red circle) at the currently tuned frequency. There are fifty available, and the first one won't be re-used until the 51st time you set a marker -- they are used in rotating order. To clear a marker, either tune to it and then press ^ M again, or if you like, you can clear them all just by holding ^ M down and letting key repeat assign and clear them all at the current frequency. If, when you release the key, there is still one marker there, just press ^ M one more time. Note that there are TCP / UDP commands to manipulate these as well, if you're interested in scripting or otherwise driving the marker display remotely.
| toc | index | guide | changes | keyboard | , previous | . next |
 S+
S+